 ExtractFox
One report, three tables, two requests
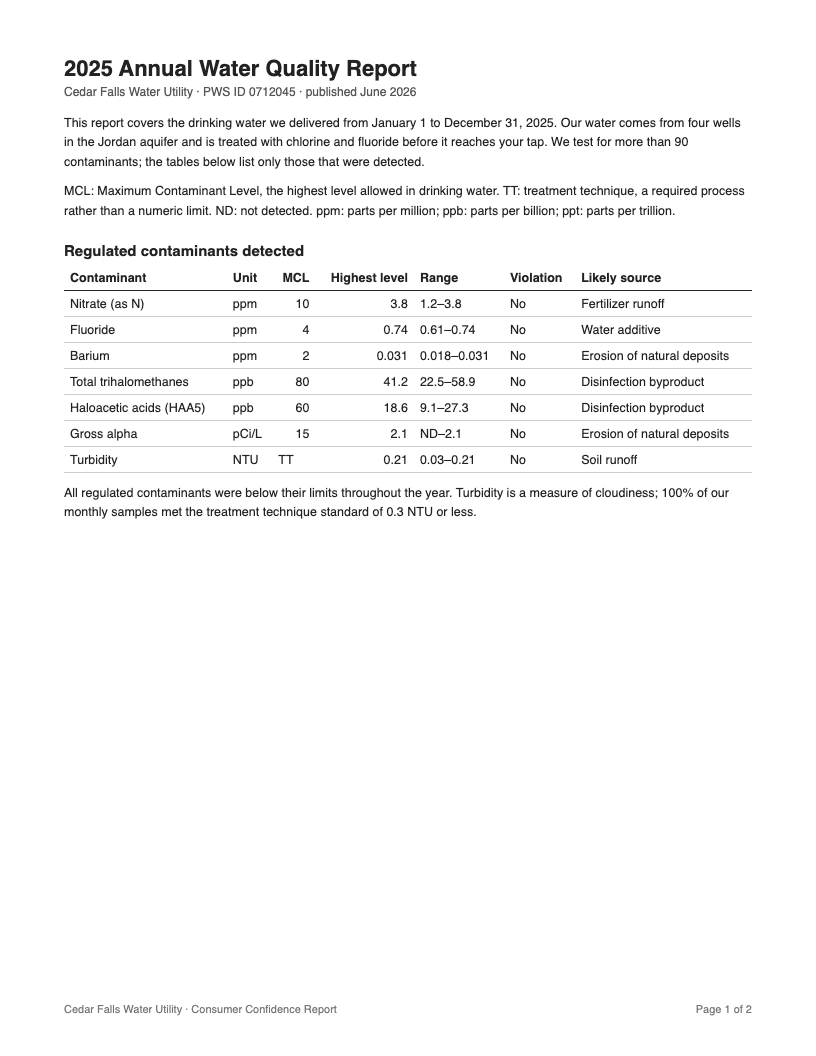
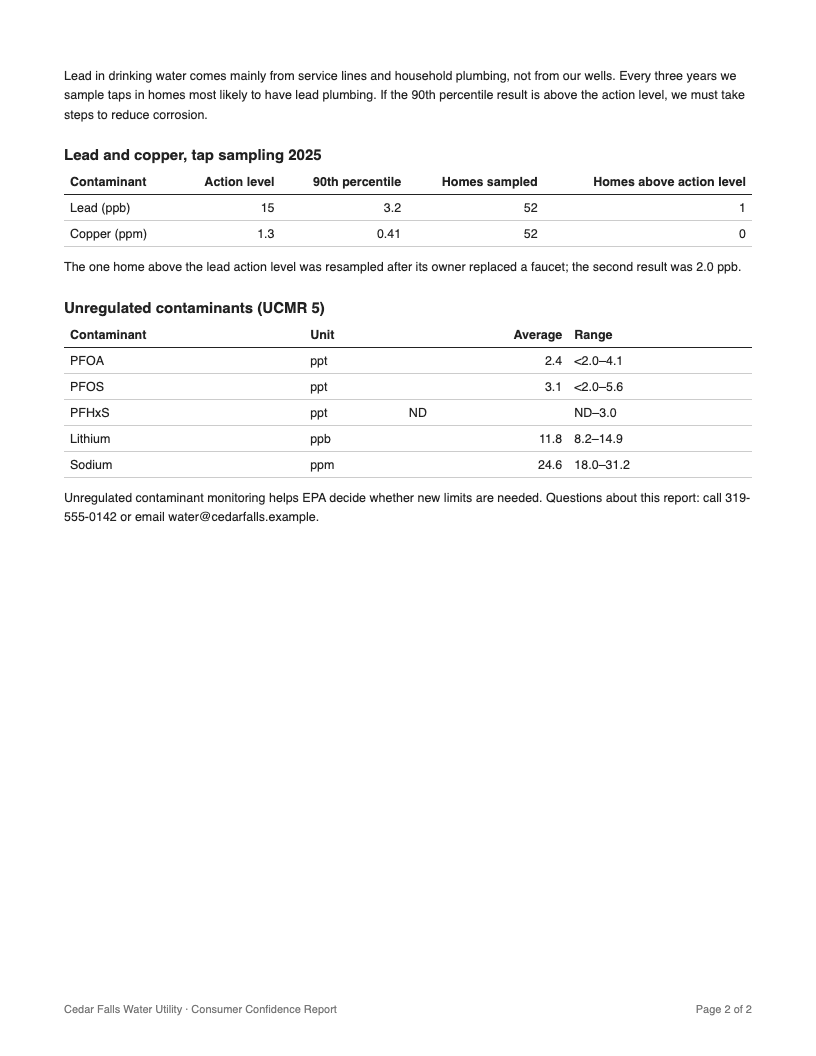
We made a two-page water quality report of the kind utilities publish every year: paragraphs of prose, then three tables of different widths. The values are what trips converters: ND (not detected), <2.0, ranges like 1.2–3.8 and MCL written as TT. The PDF went through this page twice, once with the default (every table) and once with a typed request for one table. Every cell was compared with the table we rendered. Nothing below was edited.
1. Every table (the default)
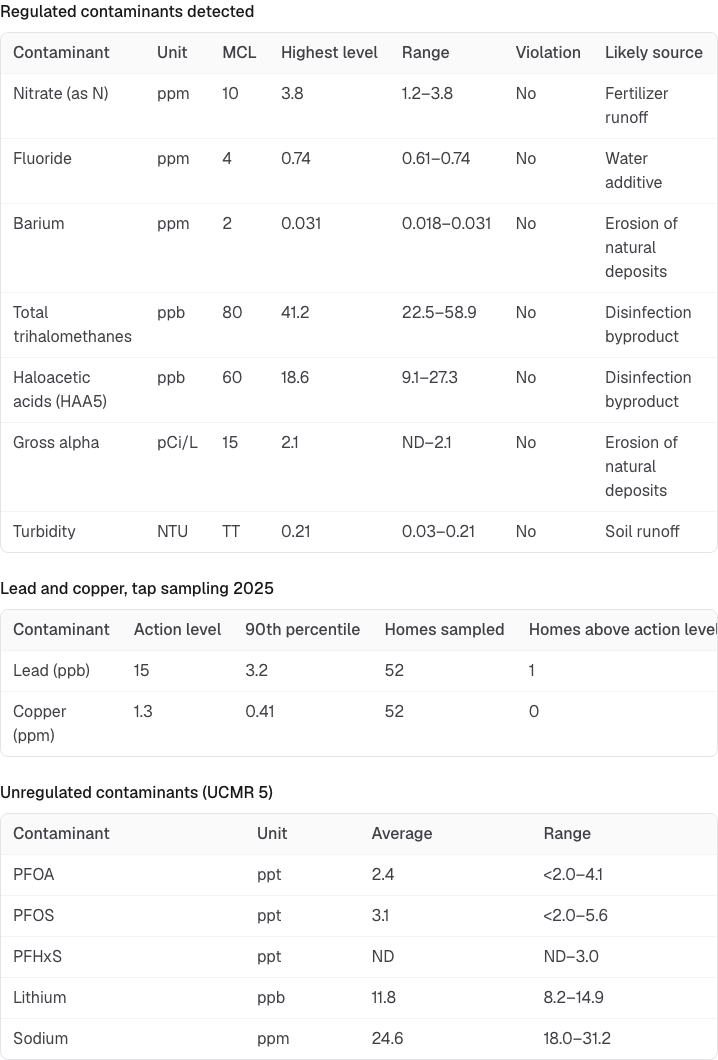
Each table came back separately with the caption printed above it, its page and its own headers. The paragraphs between them were left out. Plain numbers are numbers (MCL 10, highest level 0.031); ND–2.1, <2.0–4.1 and TT stayed text exactly as printed, so none of them became a wrong number.
{
  "tables": [
    {
      "caption": "Regulated contaminants detected",
      "page_number": 1,
      "rows": [
{ "Contaminant": "Nitrate (as N)", "Unit": "ppm", "MCL": 10, "Highest level": 3.8, "Range": "1.2–3.8", "Violation": "No", "Likely source": "Fertilizer runoff" },2. Just one table, by name
Typed in the box: "Only the lead and copper table, with its own column headers." The result was that table alone, 10 of 10 cells right, in 3.1 seconds. One thing to know: on a typed request the column names come back normalised (action_level rather than Action level); the values are untouched.
contaminant,action_level,90th_percentile,homes_sampled,homes_above_action_level
Lead (ppb),15,3.2,52,1
Copper (ppm),1.3,0.41,52,0
- Water quality report (PDF, 2 pages)
- All tables, JSON result
- Lead and copper table, CSV result
- Scores for both runs (JSON)
One report is a demonstration, not a benchmark. It was clean and digitally made; low-resolution scans, headers spanning two rows and tables without any ruling are harder. A cell that can't be read comes back empty rather than guessed.
Why copying the table out isn't enough
This PDF has a text layer, so pdftotext, which gives what copying from a PDF viewer gives, found every value. But it is text, not a table: the columns are lined up with spaces, and since Nitrate (as N) and Erosion of natural deposits contain spaces too, splitting on them breaks the rows. The paragraphs and footers come along, and nothing marks where one table ends and the next begins. On a scan there is no text to copy at all.
 Contaminant                     Unit      MCL      Highest level Range               Violation     Likely source

 Nitrate (as N)                  ppm           10              3.8 1.2–3.8            No            Fertilizer runoff

 Turbidity                       NTU      TT                  0.21 0.03–0.21          No            Soil runoff
Getting the table you want
- Name the table the way the PDF does: its caption ("Revenue by region"), or its position ("the second table on page 4"). Add the columns you want if you need fewer.
- Not sure what's in a long PDF? Pick "List of tables" first: you get each table's caption, page, columns and row count, then ask for the one you need.
- Monthly statements or a table split into several pieces with the same columns: "Merge tables" returns them as one, with the page of each row.
- For Excel with a sheet per table and numbers ready for formulas, PDF to Excel is the same reader with an Excel-first page; for CSV details (quoting, encoding) see PDF to CSV.
Sources
- pdftotext 26.10.0 (Poppler) run as pdftotext -layout file.pdf -, October 18, 2026
- ExtractFox runs on the same PDF, October 18, 2026; script in the repo at scripts/samples/pdf-table-select.mjs, method on how we test